
Apex teams rarely struggle with visibility. Most already rely on static analysis tools, PMD rules, and automated scans that surface thousands of potential issues across their codebase. The real challenge begins after the scan finishes. When everything looks like a problem, it becomes difficult to know where to focus and which changes will actually improve performance.
That tension was the starting point for this series. In the first post, we introduced ApexGuru Insights, a Salesforce tool built to help teams cut through noise and concentrate on the Apex issues that have real impact on execution, governor limits, and long-term org health. Instead of adding more findings, it reframes how teams think about prioritization.
This post builds directly on that foundation by shifting from why ApexGuru matters to how it is used in practice. We take a closer look at the ApexGuru Insights report itself and walk through how developers can read its findings, interpret risk, and turn results into clear, defensible decisions about what to fix first.
Code Recommendations: “What Should We Fix First?”
Most teams start in the same place. They want to know where to begin.
That is exactly what the Code Recommendations section is designed to answer. Each recommendation is ranked by severity as critical, major, or minor, and includes context on why the issue matters now, not just in theory.
For every finding, ApexGuru provides an explanation, the relevant code snippet, and a recommended fix. This is an important distinction. Rather than leaving developers to interpret a rule violation, ApexGuru shows how to move from problem to improvement.
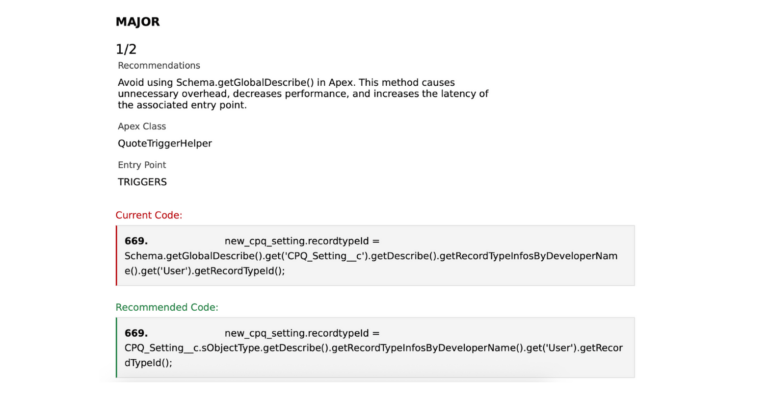
One example we often see is a recommendation to avoid using Schema.getGlobalDescribe() in Apex. ApexGuru explains that this method introduces unnecessary overhead, increases latency, and can degrade performance at runtime. The report highlights the problematic code and then presents a more efficient alternative. Applying the recommendation results in cleaner, more readable code while avoiding avoidable performance costs.
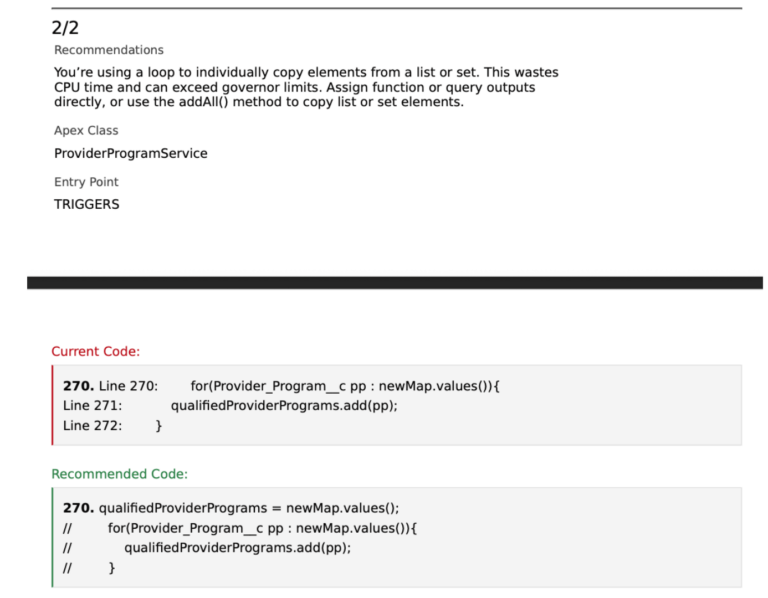
Another common finding flags code that loops through a list or set to copy elements one by one. This pattern wastes CPU time and increases the risk of hitting governor limits. ApexGuru recommends assigning outputs directly or using the addAll() method instead. The result is improved performance, lower CPU usage, and code that aligns more closely with Salesforce best practices.
Once teams have addressed these high-impact recommendations, a natural next question follows: where are we still quietly taking on risk?
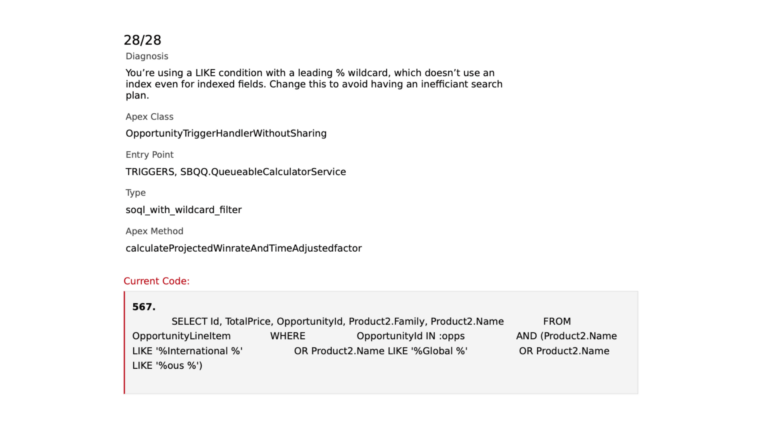
SOQL and DML Analysis: “Where Are We Quietly Taking on Risk?”
SOQL and DML usage often introduce performance and scalability issues that are not immediately obvious from reading a single method in isolation. This section shifts the focus from individual code constructs to how queries and database operations behave at runtime.
Each SOQL and DML finding is assigned a severity level and includes a description of the issue along with the relevant code snippet. Unlike the Code Recommendations section, ApexGuru does not prescribe a single remediation approach here. Query optimization and data access patterns are highly context-dependent, and the report is designed to surface risk without constraining how teams address it.
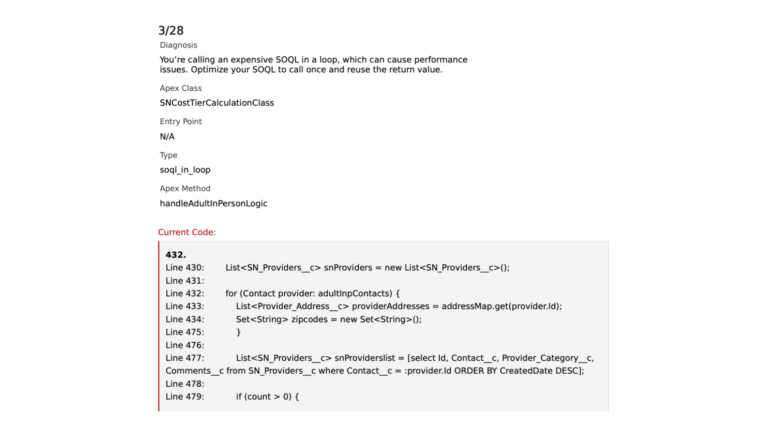
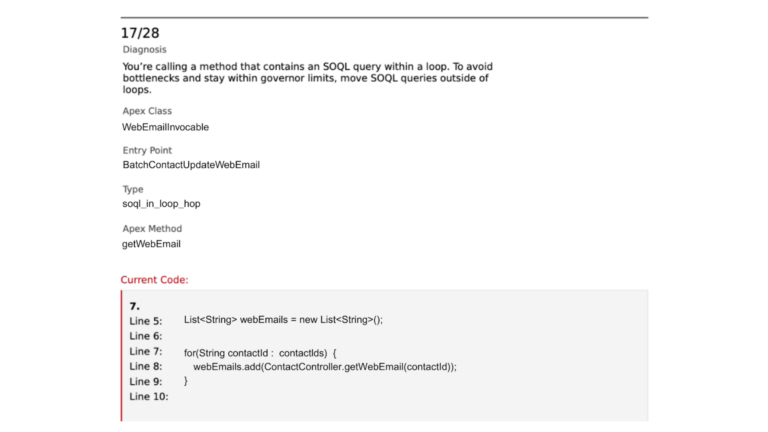
What distinguishes this analysis is ApexGuru’s ability to evaluate execution paths across method boundaries. A SOQL query directly inside a loop is flagged immediately. More importantly, ApexGuru can also identify cases where a loop invokes a method that contains a SOQL query, even when that query resides in a different class. The report also surfaces the transaction entry point, making it easier to understand how the execution flow reaches the problematic pattern.
In other cases, ApexGuru highlights queries that can become long-running as data volumes increase. These patterns may not cause issues in lower environments but can introduce performance degradation at scale. Identifying them early allows teams to address query structure and data access strategies before they become production constraints.
Once these execution-level risks are visible, teams can better assess where the impact is concentrated.
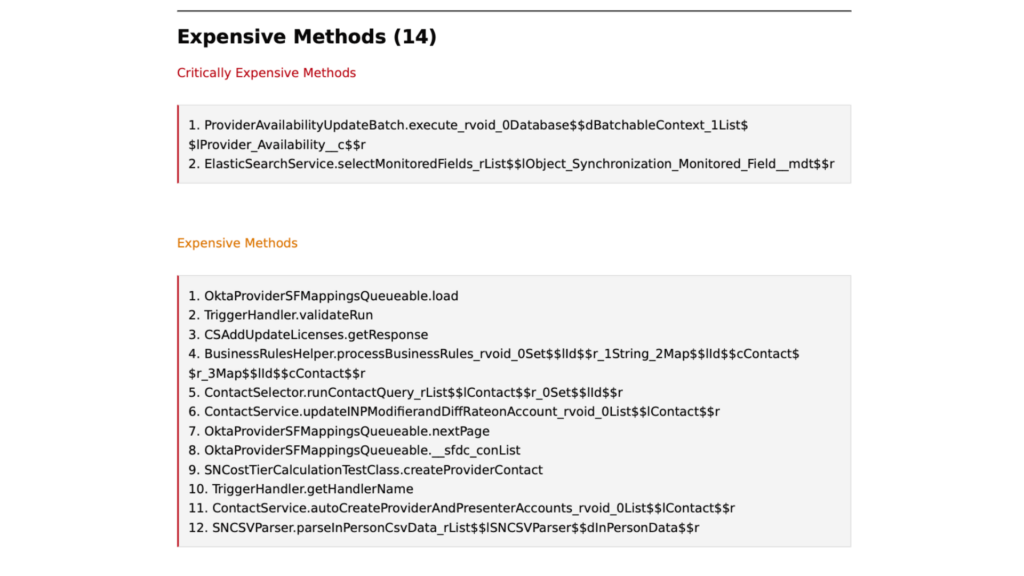
Expensive Methods: “What Is Actually Slowing Us Down?”
Not every issue in a codebase carries the same weight. Some problems are cosmetic. Others quietly consume CPU on every transaction. The Expensive Methods section is designed to separate the two by showing where execution time is actually being spent.
ApexGuru surfaces methods based on their share of total CPU usage. Critically expensive methods consume more than five percent of the available limit, while expensive methods fall between two and five percent. This distinction gives teams an objective way to focus optimization efforts where they will have the greatest impact.
More importantly, this shifts performance work from speculation to evidence. Rather than tuning code that merely looks inefficient, developers can see exactly which methods are responsible for the majority of CPU consumption. In large or long-lived orgs, this level of visibility often replaces hours of exploratory debugging with a short, targeted list of fixes.
Once these hotspots are addressed, teams often find that performance stops being the primary constraint. What remains is the longer-term challenge of keeping the codebase understandable, adaptable, and safe to change.
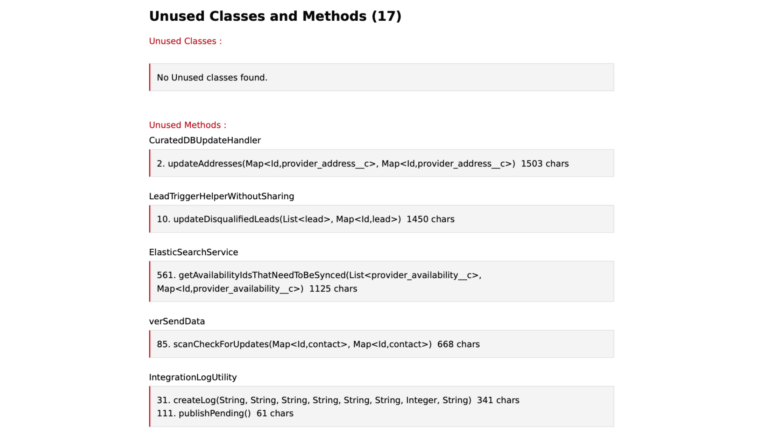
Unused Methods: “What Can We Safely Remove?”
In long-lived Salesforce orgs, unused code is almost inevitable. Features are reworked, integrations are replaced, and teams move on, but the methods created to support earlier decisions often remain. Over time, this dead code increases cognitive load, making systems harder to understand, test, and change with confidence.
ApexGuru Insights helps surface this hidden complexity by identifying methods and classes that have not been executed over time in production. Rather than relying on tribal knowledge or manual investigation, teams get visibility into code paths that appear inactive and warrant closer review. This does not replace developer judgment. Some findings represent truly unreachable code, while others may reflect logic that is still technically callable but no longer exercised by the system.
The value is not in automatic removal, but in clarity. By highlighting dormant areas of the codebase, ApexGuru gives teams a safer starting point for cleanup, refactoring, and architectural decisions. The result is a codebase that is easier to reason about and maintain as it continues to evolve.
Reducing unnecessary complexity creates space to assess how ready the system is for what comes next.
Test Cases: “How Confident Are We to Deploy?”
The final section shifts attention from individual findings to overall deployment readiness. Test coverage is not presented as an isolated metric, but as a signal that sits alongside the performance and risk indicators surfaced earlier in the report.
In isolation, coverage percentages are familiar and often misleading. In the context of ApexGuru Insights, they help teams understand where test depth aligns with critical execution paths and where gaps exist around code that already carries higher performance or scalability risk. This makes it easier to assess confidence in change, not just compliance with coverage thresholds.
Viewed this way, test cases become less about satisfying a platform requirement and more about validating that the most important parts of the system behave as expected under real conditions. That perspective turns test coverage into a practical input for release decisions rather than a last-minute gate.
From Insight to Execution
Taken together, the five sections of the ApexGuru Insights report transform a broad code scan into a structured path from diagnosis to action. Instead of surfacing volume for its own sake, the report helps teams focus on the issues that materially affect performance, scalability, and long-term maintainability.
Part One of this series focused on reducing noise and restoring signal. This second part shows how that signal is applied in practice. ApexGuru Insights does not just identify issues. It establishes order, helping developers understand what to address first, what can wait, and how those decisions connect to real execution behaviour in the org.
For teams looking to assess Apex code health without slowing delivery or increasing cognitive load, the question becomes less about tooling and more about focus. What would it change if your team could consistently prioritize the work that matters most? Let’s chat.